- Data from the CDC and state DHHS show that North Carolina has not been suffering excess deaths from Covid-19 since mid-March 2021
- While Covid-19 is still out there, its effect on North Carolina is no longer causing a statistical anomaly in terms of deaths, meaning it is behaving more and more like an endemic virus, such as a flu, not a pandemic
- If North Carolina is no longer witnessing excess deaths owing to Covid-19, then why does Gov. Cooper still keep the state in the minority of U.S. states still under a “State of Emergency”?
North Carolina has not been suffering excess deaths from Covid-19 since mid-March. That’s according to data from the Centers for Disease Control and Prevention (CDC) and the North Carolina Department of Health and Human Services (DHHS).
What it means is that deaths in North Carolina from all causes, including Covid-19, are within the normal range of deaths one would expect for this time of year. The pandemic is becoming endemic, and the deaths it is contributing to North Carolina are not unlike that of flu in a random year.
This information is important to know amid concerns over the delta variant of Covid-19, which is said to be more infectious and which is behind a recent increase in lab-confirmed cases in North Carolina. But more infectious is not the same as more dangerous, and vaccine-induced and natural immunity are now factoring in — bringing about what experts call the “decoupling” between infections and severe illness and death.
Furthermore, the delta variant is already showing signs of having peaked in the states hardest hit by it, as well as the United Kingdom, India, and other affected regions. Nevertheless, the CDC abruptly changed its guidance to recommend that vaccinated people wear masks indoors in most parts of the country, and Gov. Roy Cooper has slated a press briefing today to address those recommendations. As of this writing, it’s unclear whether he will follow the CDC in that he will recommend the same and let his order expire as scheduled on July 30, or if he will use the CDC recommendation as a pretext for reimposing tighter restrictions against people, schools, and businesses or even imposing new ones.
What are “Excess Deaths,” and how does the CDC determine them?
The CDC maintains its Excess Deaths dashboard to help pinpoint an unusual outbreak of deaths in a part of the country, week to week, regardless of the reason for the fatalities. It uses a weekly expected number of deaths based on the state’s average number of deaths for that point in time, estimated over a number of years. Should actual deaths from all causes exceed the upper-bound 95 percent prediction interval of expected deaths — which represents a one-in-20-years statistical anomaly — the CDC determines that an “excess death” event has occurred, and health officials will investigate.
That “upper bound of the 95% prediction interval of the expected number of deaths” is the excess death threshold above which excess deaths are said to occur. As you would expect, North Carolina has been above the excess death threshold for most weeks during the pandemic.* Since mid-March, however, North Carolina has not been witnessing excess death events from Covid-19. The virus is still out there, yes, but its effect on North Carolina is not causing a statistical anomaly in terms of deaths. It is behaving more and more like an endemic virus, such as a flu, not a pandemic.
Determining excess deaths — or not — from Covid-19 in North Carolina
While people in any other state can simply look up their state’s entry in the CDC dashboard to see how their state has fared in recent months, people in North Carolina can’t. That’s because DHHS under state health secretary Mandy Cohen is running nearly five months behind the rest of the nation in reporting all-cause death data to the CDC. As of this writing North Carolina has reported data only through February 27, even as the rest of the nation has reported through July 17.
DHHS’s lack of reporting doesn’t mean we can’t tell if North Carolina has been witnessing excess deaths from Covid. We demonstrated last year how to do it. Even though North Carolina is behind, the CDC has published their expected average deaths and upper-bound (excess death) threshold numbers for North Carolina. DHHS updates North Carolina’s number of Covid deaths daily.
So for any given week, we can make a comparison of two numbers. The first number tells us how many Covid deaths would be necessary to signal an excess death event. We can get that number by subtracting the expected average deaths from the excess death threshold. We can then compare that number with the actual number of Covid deaths for the week from DHHS. If the number of Covid deaths is higher, it means there likely has been excess deaths from Covid. If it’s lower, there hasn’t been.
Below is a chart plotting North Carolina’s weekly Covid-19 deaths against the CDC weekly excess death threshold. These data go back to the first week of March 2020 and extend to the last week of estimates provided by the CDC (July 17, 2021). An appendix at the end of this post provides the data table.
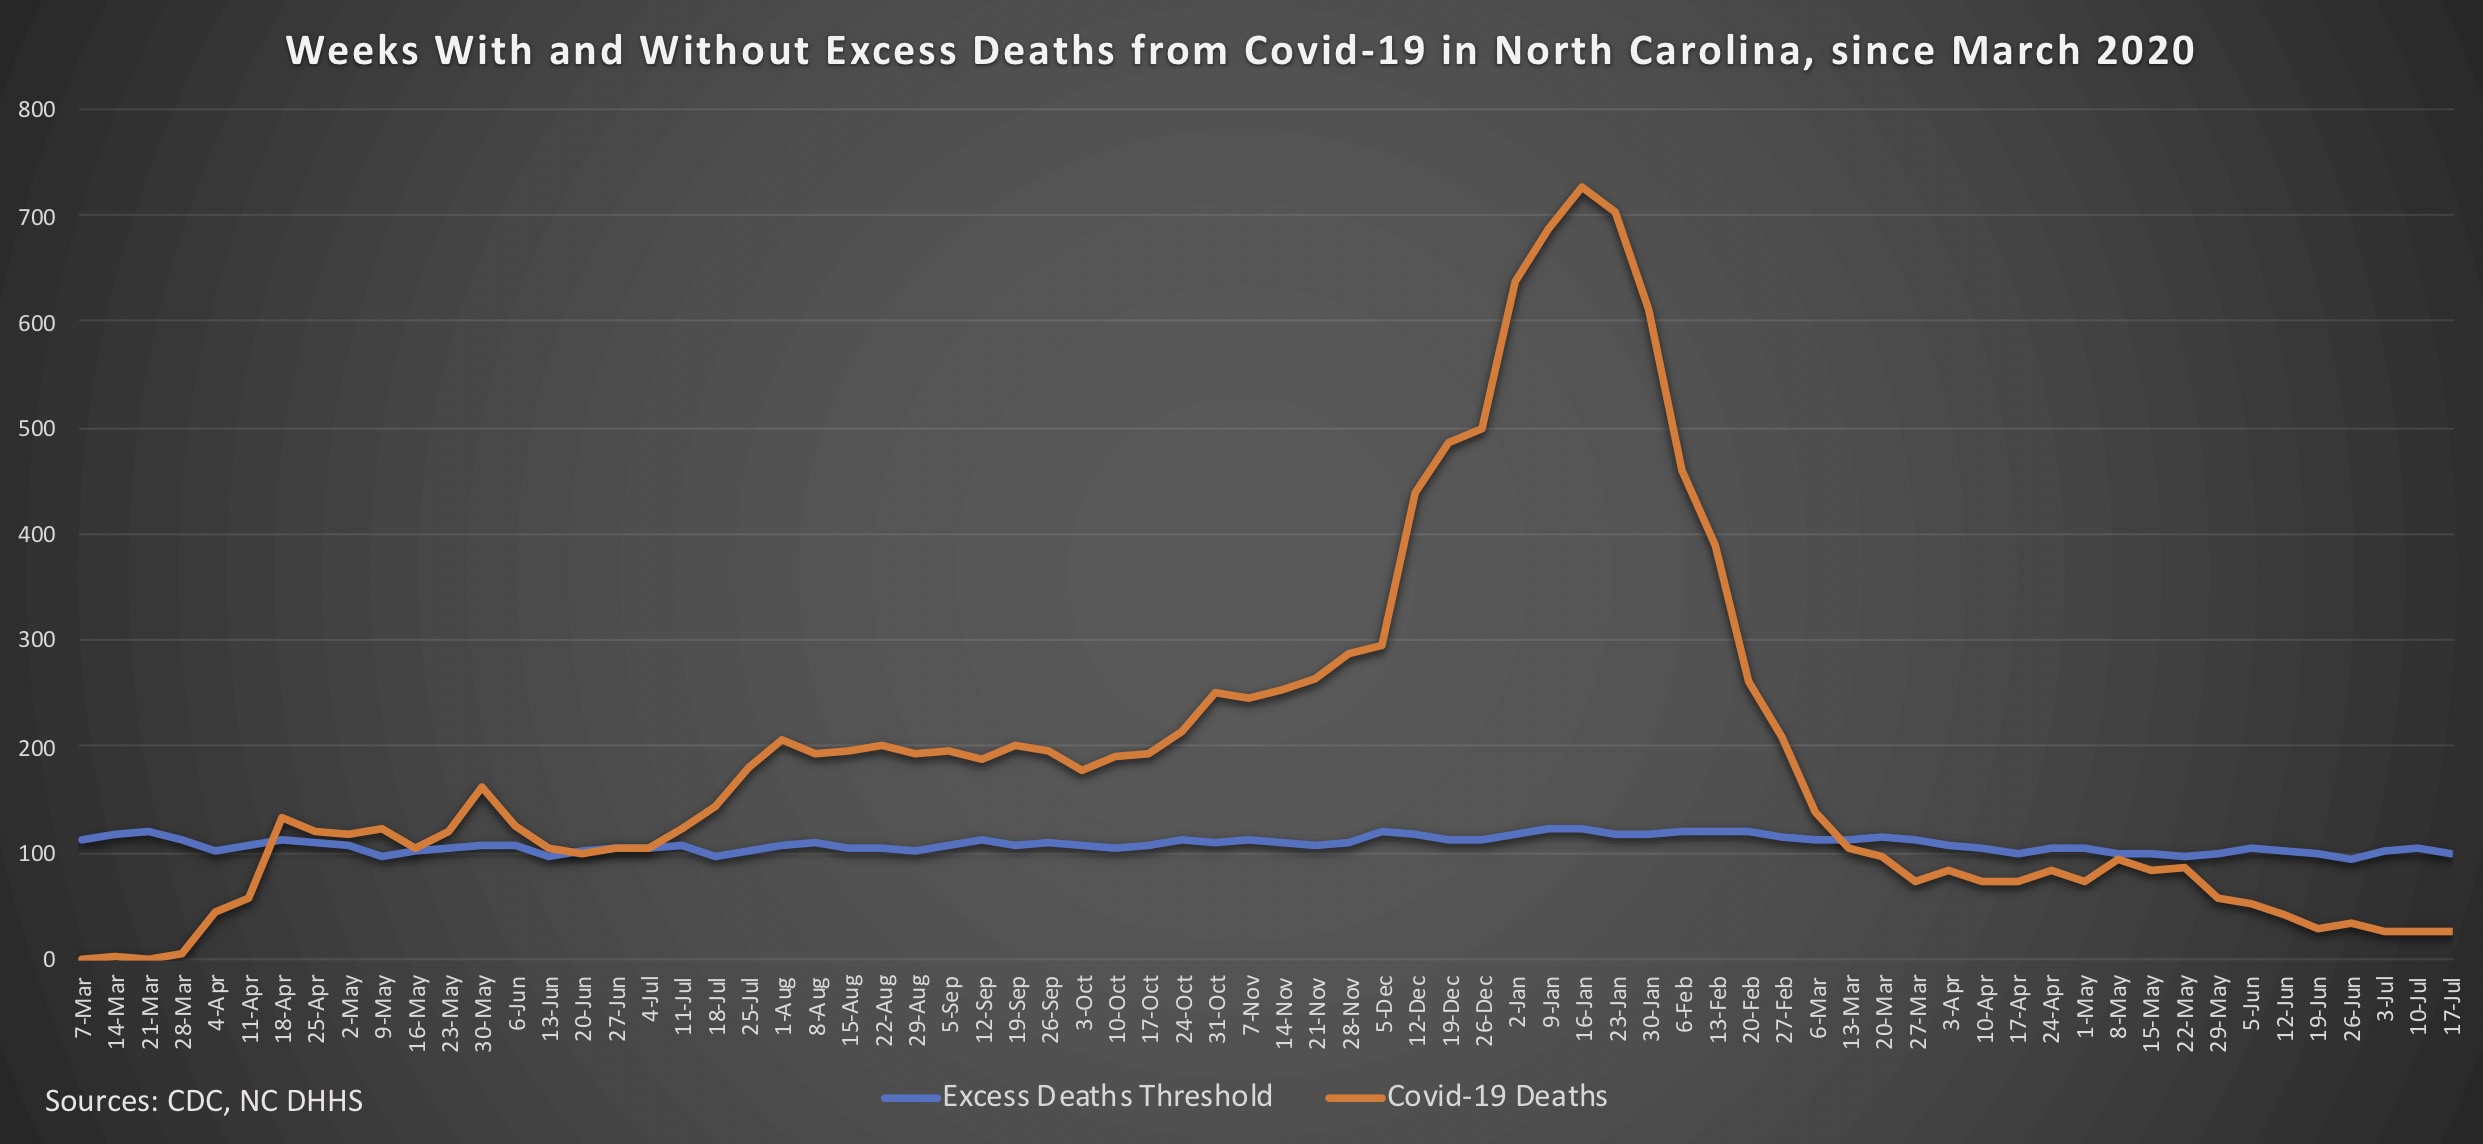
Covid’s peak in early winter is evident. But as you can see, North Carolina has not been suffering excess deaths owing to Covid-19 since mid-March 2021.
A “State of Emergency”?
If North Carolina is no longer witnessing excess deaths owing to Covid-19, then why does Gov. Roy Cooper still keep the state under a “State of Emergency” declaration? There are other reasons to think that numbers in this state do not rise to the level of obvious, immediate danger as to warrant a statewide emergency.
Increasing Herd Immunity
As of this writing, an estimated 75.3% of adult North Carolinians have vaccine-induced or natural immunity from Covid-19. Cooper had predicated lifting all restrictions based on two-thirds (66.7%) of adults being partially vaccinated, with no regard paid to those with natural immunity. Using CDC estimates of actual infections and DHHS estimates of current vaccinations (61% at least partially vaccinated) and the formula outlined here, over three-fourths (75.3%) of adult North Carolinians are estimated to have immunity. Furthermore, including vaccinated and naturally immune children (18 and under) into the mix, North Carolina is at 70.9% immunity. As a reminder, it is widely accepted that herd immunity from Covid-19 is with at least 70% of people immune.
High Threat-Free Index
The most recent NC Threat-Free Index found that 99.8% of North Carolinians posed no conceivable threat of passing along Covid-19 to anyone. Active cases represented 0.17% of the state’s population (that’s less than two-tenths of a percent).
Governor’s Stated Rationale for the State of Emergency
Cooper has frequently linked his “State of Emergency” not with an emergency, but with being able to capture federal funds. As he stated in his June 2 press briefing, “The state of emergency needs to continue. We need to continue to draw down federal funds.” And the “Frequently Asked Questions” for his current order states outright that “The State of Emergency maintains state’s ability to receive federal funding to meet challenges presented by COVID-19.”
This novel justification does not seem rooted in reality, however, given that other states have lifted emergency declarations. North Carolina is among a minority of states still under a state of emergency. Regardless, it is highly indicative that the rationale isn’t a state of emergency, but a state of grasping opportunism.
The state Emergency Management Act (EMA) was never intended for use in perpetuity, especially not as a lever to “draw down federal funds” as an end in itself. Covid-19 may be fading into an endemic virus, but the need to reform the EMA is as pressing as ever.
Note
* Also, for most weeks, there has actually been another, non-Covid excess death event happening concurrently with Covid excess deaths. Based on a growing body of research warning against this very outcome, this death event likely owes to negative unintended consequences from Cooper’s lockdowns and extreme personal, school, and business restrictions in response to Covid-19.
Appendix: Data Table for the Chart
Weeks With and Without Excess Deaths from Covid-19 in North Carolina, since March 2020
| Week ending date | Average deaths expected | Upper bound (excess deaths threshold) | Number of deaths above average to be considered excess deaths | Covid deaths for the week | Difference | Covid excess death event likely? |
|---|---|---|---|---|---|---|
| March 7, 2020 | 1985 | 2097 | 112 | 0 | -112 | NO |
| March 14, 2020 | 1989 | 2106 | 117 | 1 | -116 | NO |
| March 21, 2020 | 1990 | 2109 | 119 | 0 | -119 | NO |
| March 28, 2020 | 1966 | 2079 | 113 | 6 | -107 | NO |
| April 4, 2020 | 1922 | 2023 | 101 | 43 | -58 | NO |
| April 11, 2020 | 1895 | 2001 | 106 | 57 | -49 | NO |
| April 18, 2020 | 1870 | 1981 | 111 | 133 | 22 | YES |
| April 25, 2020 | 1847 | 1957 | 110 | 120 | 10 | YES |
| May 2, 2020 | 1818 | 1925 | 107 | 117 | 10 | YES |
| May 9, 2020 | 1802 | 1898 | 96 | 123 | 27 | YES |
| May 16, 2020 | 1807 | 1909 | 102 | 104 | 2 | YES |
| May 23, 2020 | 1800 | 1904 | 104 | 120 | 16 | YES |
| May 30, 2020 | 1789 | 1897 | 108 | 162 | 54 | YES |
| June 6, 2020 | 1798 | 1904 | 106 | 126 | 20 | YES |
| June 13, 2020 | 1781 | 1877 | 96 | 104 | 8 | YES |
| June 20, 2020 | 1788 | 1890 | 102 | 98 | -4 | NO |
| June 27, 2020 | 1780 | 1885 | 105 | 103 | -2 | NO |
| July 4, 2020 | 1763 | 1868 | 105 | 103 | -2 | NO |
| July 11, 2020 | 1764 | 1871 | 107 | 122 | 15 | YES |
| July 18, 2020 | 1752 | 1848 | 96 | 143 | 47 | YES |
| July 25, 2020 | 1739 | 1840 | 101 | 179 | 78 | YES |
| August 1, 2020 | 1718 | 1826 | 108 | 206 | 98 | YES |
| August 8, 2020 | 1718 | 1827 | 109 | 192 | 83 | YES |
| August 15, 2020 | 1721 | 1825 | 104 | 196 | 92 | YES |
| August 22, 2020 | 1724 | 1829 | 105 | 201 | 96 | YES |
| August 29, 2020 | 1722 | 1824 | 102 | 194 | 92 | YES |
| September 5, 2020 | 1710 | 1817 | 107 | 196 | 89 | YES |
| September 12, 2020 | 1726 | 1837 | 111 | 189 | 78 | YES |
| September 19, 2020 | 1737 | 1845 | 108 | 201 | 93 | YES |
| September 26, 2020 | 1740 | 1850 | 110 | 196 | 86 | YES |
| October 3, 2020 | 1771 | 1879 | 108 | 178 | 70 | YES |
| October 10, 2020 | 1773 | 1878 | 105 | 191 | 86 | YES |
| October 17, 2020 | 1787 | 1895 | 108 | 194 | 86 | YES |
| October 24, 2020 | 1800 | 1912 | 112 | 214 | 102 | YES |
| October 31, 2020 | 1810 | 1920 | 110 | 250 | 140 | YES |
| November 7, 2020 | 1830 | 1943 | 113 | 246 | 133 | YES |
| November 14, 2020 | 1846 | 1955 | 109 | 253 | 144 | YES |
| November 21, 2020 | 1856 | 1962 | 106 | 265 | 159 | YES |
| November 28, 2020 | 1866 | 1976 | 110 | 288 | 178 | YES |
| December 5, 2020 | 1904 | 2023 | 119 | 294 | 175 | YES |
| December 12, 2020 | 1927 | 2043 | 116 | 439 | 323 | YES |
| December 19, 2020 | 1949 | 2062 | 113 | 487 | 374 | YES |
| December 26, 2020 | 1981 | 2094 | 113 | 499 | 386 | YES |
| January 2, 2021 | 2014 | 2130 | 116 | 638 | 522 | YES |
| January 9, 2021 | 2018 | 2141 | 123 | 688 | 565 | YES |
| January 16, 2021 | 2043 | 2165 | 122 | 726 | 604 | YES |
| January 23, 2021 | 2068 | 2185 | 117 | 702 | 585 | YES |
| January 30, 2021 | 2063 | 2181 | 118 | 611 | 493 | YES |
| February 6, 2021 | 2075 | 2195 | 120 | 461 | 341 | YES |
| February 13, 2021 | 2068 | 2188 | 120 | 390 | 270 | YES |
| February 20, 2021 | 2050 | 2169 | 119 | 260 | 141 | YES |
| February 27, 2021 | 2023 | 2138 | 115 | 210 | 95 | YES |
| March 6, 2021 | 2002 | 2114 | 112 | 137 | 25 | YES |
| March 13, 2021 | 1970 | 2082 | 112 | 104 | -8 | NO |
| March 20, 2021 | 1957 | 2072 | 115 | 97 | -18 | NO |
| March 27, 2021 | 1956 | 2069 | 113 | 74 | -39 | NO |
| April 4, 2021 | 1937 | 2045 | 108 | 82 | -26 | NO |
| April 10, 2021 | 1921 | 2026 | 105 | 72 | -33 | NO |
| April 17, 2021 | 1916 | 2014 | 98 | 73 | -25 | NO |
| April 24, 2021 | 1894 | 1998 | 104 | 84 | -20 | NO |
| May 1, 2021 | 1872 | 1976 | 104 | 73 | -31 | NO |
| May 8, 2021 | 1869 | 1969 | 100 | 93 | -7 | NO |
| May 15, 2021 | 1868 | 1967 | 99 | 84 | -15 | NO |
| May 22, 2021 | 1854 | 1950 | 96 | 87 | -9 | NO |
| May 29, 2021 | 1865 | 1965 | 100 | 56 | -44 | NO |
| June 5, 2021 | 1848 | 1953 | 105 | 52 | -53 | NO |
| June 12, 2021 | 1845 | 1947 | 102 | 42 | -60 | NO |
| June 19, 2021 | 1849 | 1949 | 100 | 28 | -72 | NO |
| June 26, 2021 | 1850 | 1945 | 95 | 33 | -62 | NO |
| July 3, 2021 | 1816 | 1918 | 102 | 25 | -77 | NO |
| July 10, 2021 | 1810 | 1914 | 104 | 26 | -78 | NO |
| July 17, 2021 | 1794 | 1894 | 100 | 26 | -74 | NO |